Timegraph
The timegraph block collects the actual measurement data of one or more Domoticz devices, and shows them in a moving time chart.
blocks[43] = {
    type: 'timegraph',
    values: ['NettUsage'],
    duration: 60
}
There is no permanent storage: After a refresh of Dashticz the previously collected data is lost.
Block parameters
Parameter |
Description |
|---|---|
width |
The width of the block relative to the column width
1..12 |
title |
Custom title for the block
'<string>' |
icon |
Defines the icon for this block, choose from: https://fontawesome.com/icons?d=gallery&m=free
'fas fa-eye' |
image |
If you want to show an image instead of an icon, place image in
img/ folder'bulb_off.png' |
type |
type must be set to
'timegraph' for a time graph'timegraph' |
height |
The graph height.
'300px': The graph will have a height of 300 pixels |
duration |
Duration of the chartwindow in seconds.
60: Default: 300 (=5 minutes) |
xTicks |
Number of labels on the x-axis (= time axis)
10 (=default) |
xTicks |
Number of labels on the y-axis (= vertical axis)
5 (=default) |
xLabels |
To show labels on the x-axis
true (=default): Show labels on the x-axisfalse : Hide labels on the x-axis |
animation |
Duration of the animation effect in msec. (Default: 0).
0 ... 1000. Maximum recommended value is 1000 msec |
lineTension |
With this parameter you can smoothen the graph line.
0: No smoothing0.1: Default1: Maximum smoothing |
pointRadius |
Size of the dot of the data sample in the graph.
1: Minimum (=default)10: Pretty big |
idx |
The main Domoticz device index for this block. |
values |
List of values to show in the timegraph. See below for examples. |
Usage
The values parameter is the most important parameter for this block. You can use it to select the data you want to show from your device.
It’s also possible to combine data from several devices in one graph.
Example to show the temperature of a THB device:
blocks[659] = {
    type: 'timegraph',
    values: ['Temp'],
    duration: 60
}
To show the usage and delivery graph of a P1 meter:
blocks[43] = {
    type: 'timegraph',
    values: ['Usage', 'UsageDeliv'],
}
For a P1 meter it makes more sense to combine Usage and UsageDeliv into one graph. Dashticz recognizes the custom field name NettUsage for this
blocks[43] = {
    type: 'timegraph',
    values: ['NettUsage'],
}
If a values element is a string, then it’s interpreted as the field name of the domoticz device.
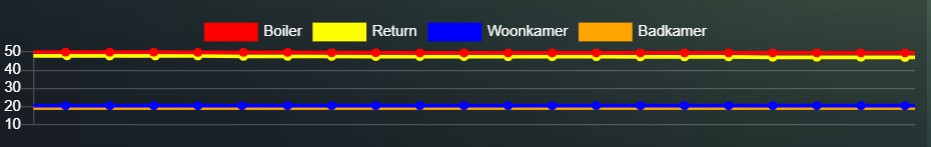
To combine data from several devices use the following notation for the values block parameter
blocks['temps'] = {
    type: 'timegraph',
    duration: 600,
    height: '100px',
    xLabels: false,
    values: [
        { idx: 28, value: 'Temp', label: 'Boiler'},
        { idx: 31, value: 'Temp', label: 'Return'},
        { idx: 27, value: 'Temp', label: 'Woonkamer'},
        { idx: 659, value: 'Temp', label: 'Badkamer'}
    ]
}
In the previous example the values elements are defined as objects. You can use the following parameters for each values element:
Parameter |
Description |
|---|---|
idx |
|
value |
|
label |
|